We’ve had a use case we had been talking abut for some time to build some type of report allow us to check that all our RPD connections are functioning. Originally after each deployment or maintenance activity we would need to navigate to multiple dashboard reports for each database and check for errors. As the number of underlying databases in our RPD grew, this was becoming more and more burdensome, so we wanted to have a single place to check on all at once.
Option 1: Set up repository variables for each connection pool.
I thought about creating an init block and database name / username variables, and then referencing these variables from a dashboard report. But we have multiple physical layer database objects, and thus we would need multiple init blocks and variables for each. I like to avoid RPD changes when possible to so looked for other ideas. (I also ran into some issues where a connection pool would be blacklisted if the init block failed, which was a situation I would want to avoid in a production environment).
Option 2: Call the Oracle function SYS_CONTEXT from Answers directly.
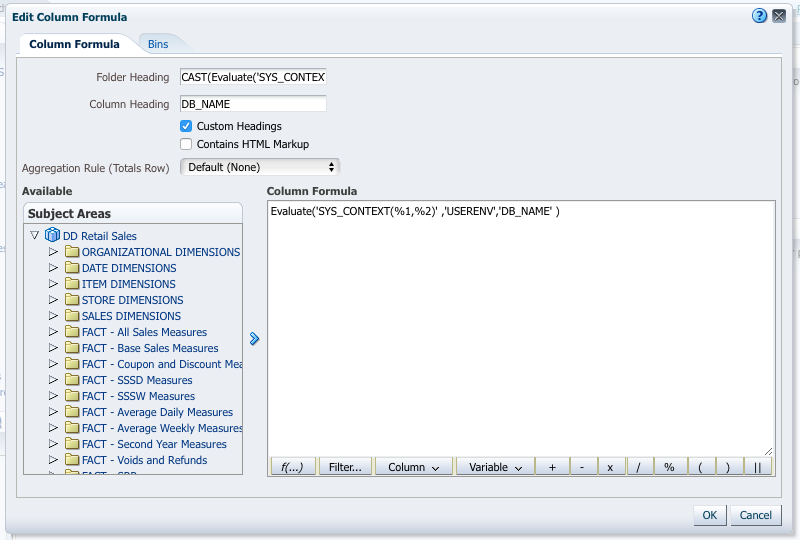
With this solution (which I ultimately went with), I created a report in Answers for each physical layer database I wanted to find connection parameters. I added two columns (one for each DB_NAME and SESSION_USER) and then called the function using the Evaluate() BI function:

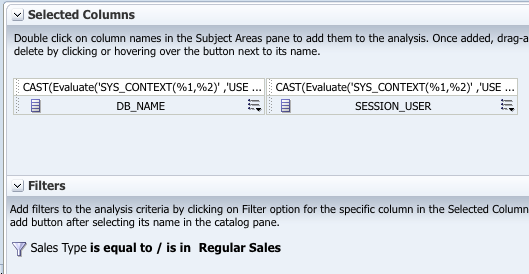
Since these are not repository variables, I had to include regular presentation columns in the report in order for the BI server to determine which connection pool to use. I had to take care in some scenarios, as we have come columns (such as our date dimension) that are mapped to multiple logical table sources, each from a different underlying database. In these scenarios, I created a query that I knew would be forced to go to a specific database, and then I knew that I could rely on this query to always give me the details for a specific database. In this scenario, the dimension attribute ‘Sales Type’ is only mapped to a single physical table, so I know that this query will always go to a specific database:

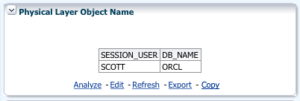
I did this for each our of physical layer database objects, and then created a dashboard page to show the status of all at once. I put each report in it’s own dashboard section, showing the section header and title. This is needed because if the report errors, I needed to be able to still show on the dashboard which connection was showing an error.

This now allows us to quickly access this page after any deployment or maintenance activity to do a quick health check that all the connections are functioning properly. It also allows us to easily check which database an environment is connecting to, which can be useful in a shared development environment.
I used these two posts as reference / guidance on how to solve for our use case:
http://obiee101.blogspot.com/2008/08/obiee-identifying-server.html
http://tipsonobiee.blogspot.com/2012/03/connection-pool-information-as-bi.html
